During the weekend that began on Friday, March 18, there were nearly 25,000 COVID-19 tests administered in Connecticut, resulting in 603 confirmed COVID-19 cases for a 2.49 percent positivity rate, holding steady from the previous week.
Five new COVID-19 patients were admitted to Connecticut hospitals over the weekend, bringing the number being treated statewide to 97, down from nearly 150 as recently as two weeks ago.
Of the 97 COVID-19 patients still being treated in Connecticut, officials noted that 43 (44.3 percent) were not fully vaccinated, a figure down from the previous week.
Since the pandemic began in March 2020, there have been more than 10,600 virus-related deaths.
Nearly 15.4 million tests have been administered since the pandemic began in Connecticut, resulting in a total of 732,471 confirmed cases of the virus.
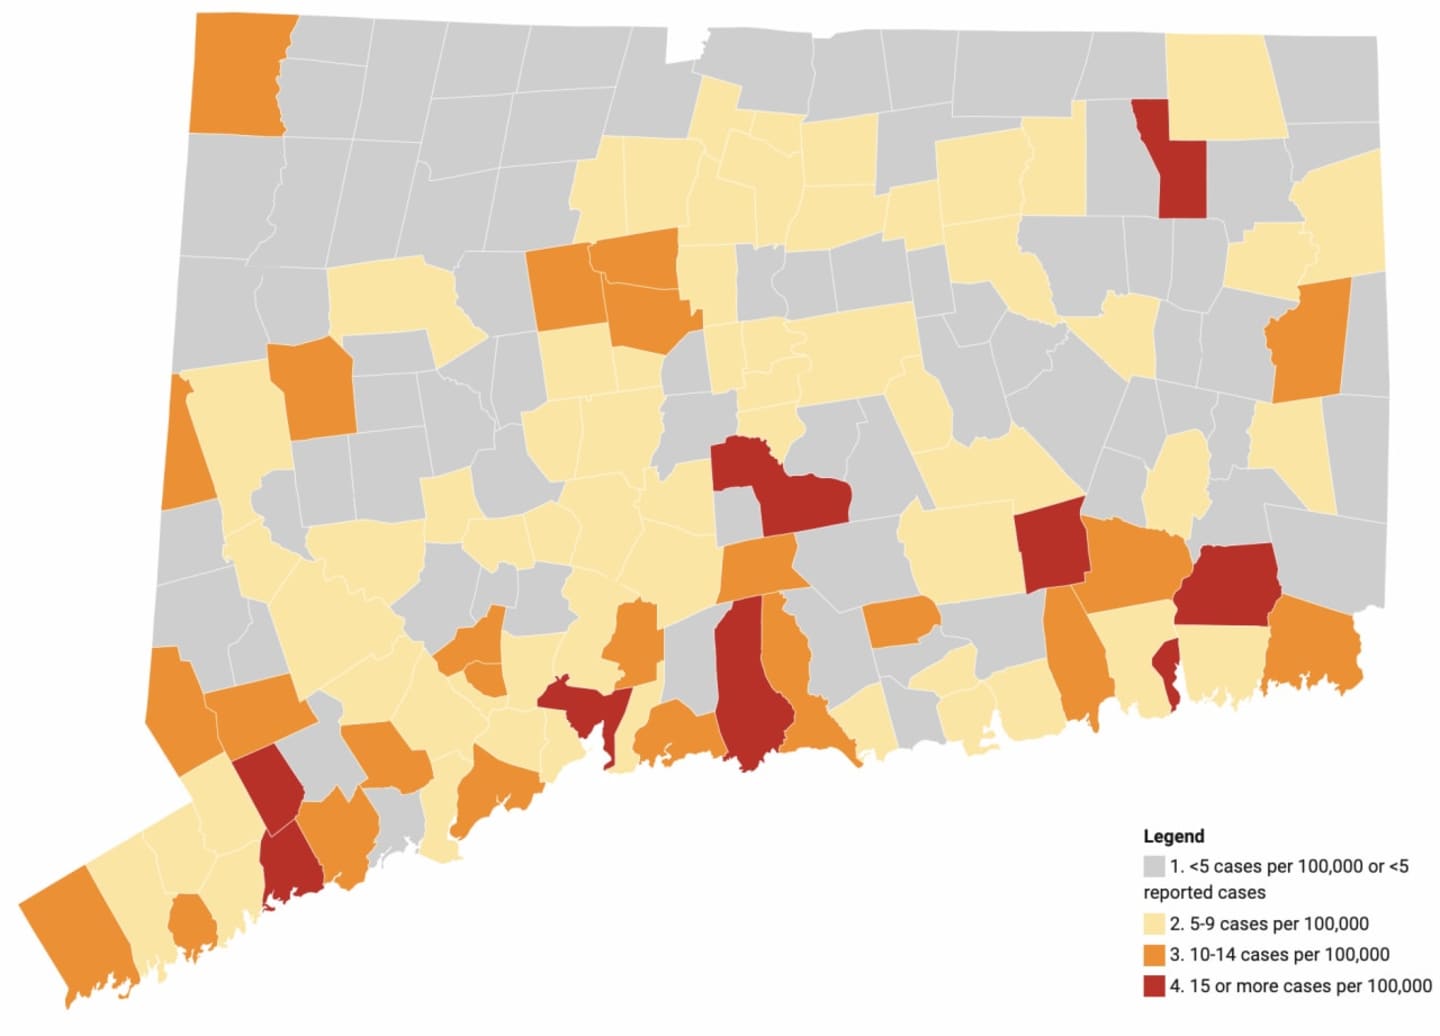
The latest breakdown of confirmed COVID-19 cases and deaths in Connecticut since the beginning of the pandemic, by county on Monday March 21:
- Fairfield: 200,481 (2,684 deaths);
- New Haven: 193,481 (2,780);
- Hartford: 175,645 (3,104);
- New London: 54,240 (646);
- Litchfield: 31,446 (452);
- Middlesex: 27,744 (478);
- Windham: 25,496 (296);
- Tolland: 20,284 (268);
- Unknown: 2,844 (9).
As of March 21, more than 3 million Connecticut residents have received at least one dose of the COVID-19 vaccine, and more than 2.75 million have completed the vaccination process. The state has also administered nearly 1.5 million booster shots.
A breakdown of which populations have received the most vaccines, by age group:
- 65+: >95 percent
- 55-64: >95 percent;
- 45-54: 91 percent;
- 35-44: 93 percent;
- 25-34: 89 percent;
- 18-24: 84 percent;
- 16-17: 88 percent;
- 12-15: 81 percent;
- 5-11: 47 percent.
A complete list of cases, by communities, can be found here by clicking and scrolling down.
Click here to follow Daily Voice Norwalk and receive free news updates.